Thermal benchmark of 3-Level 3-phase Voltage Source Inverters
Download python script for simulation
Download python script for plotting
Download Python Library requirements
Review of topology candidates
This example proposes a python script which provides a thermal benchmark of three topologies of 3-Level 3-phase Voltage Source Inverters:
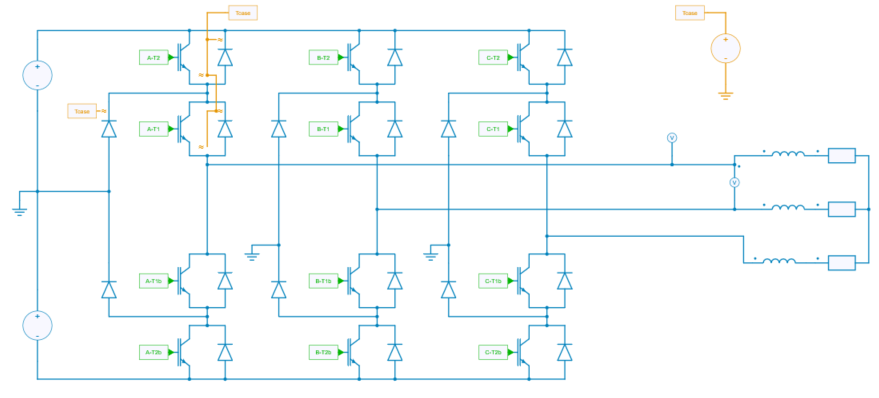
- a Neutral Point Clamped (NPC),
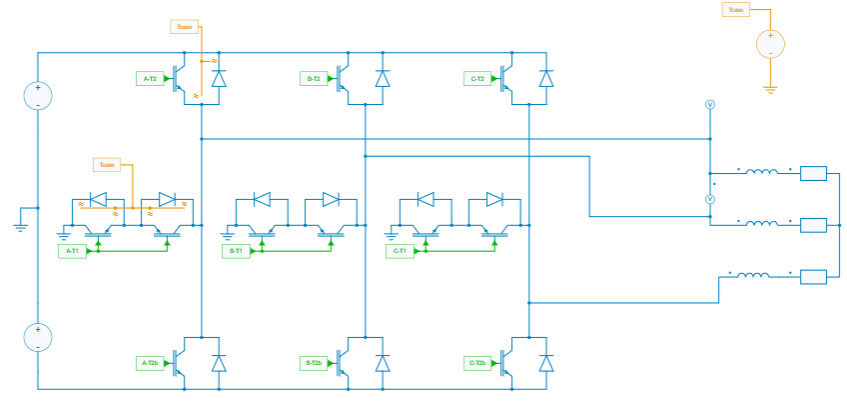
- a T-Type,
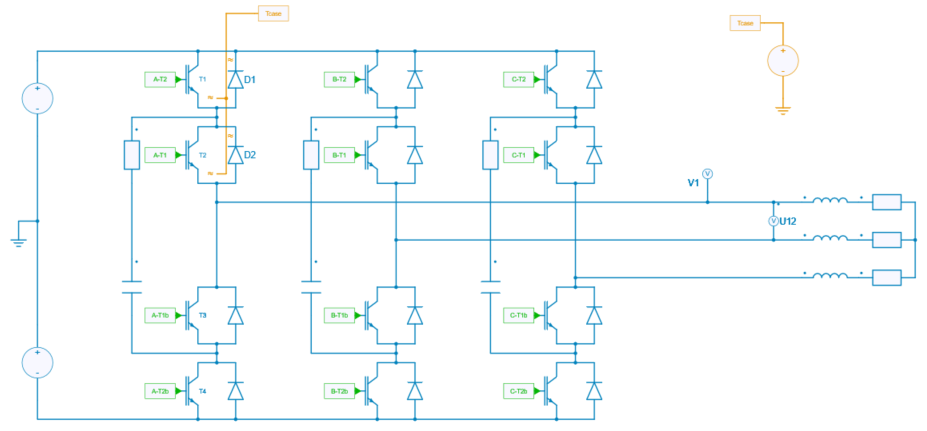
- a Flying Capacitor (FC),
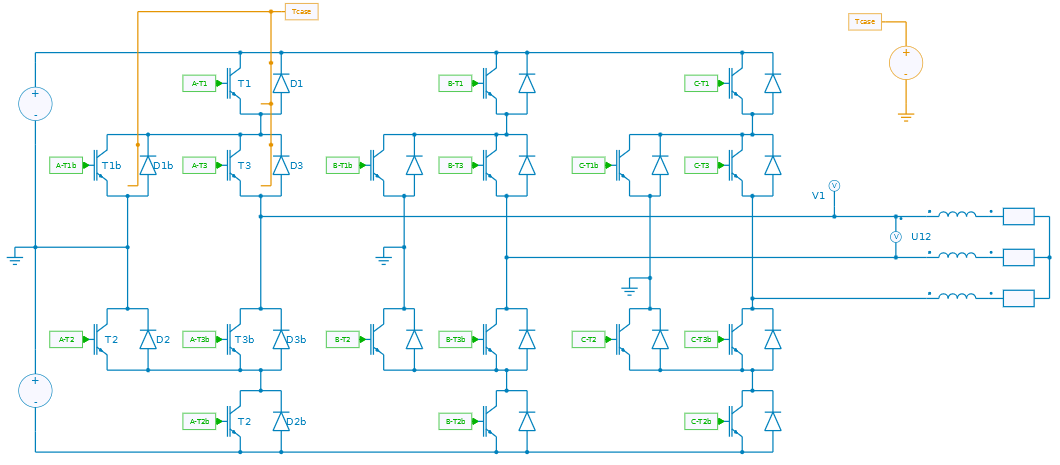
- an Active Neutral Point Clamped (ANPC).
The figures below show these different topologies.
The requirements are:
- DC voltage: 700 V,
- Power: 40.9 kW,
- Fundamental frequency: 50 Hz,
- Apparent Switching frequency: 15 kHz.
All the topologies are compared with the same AC load and control which has been considered in open-loop.
note
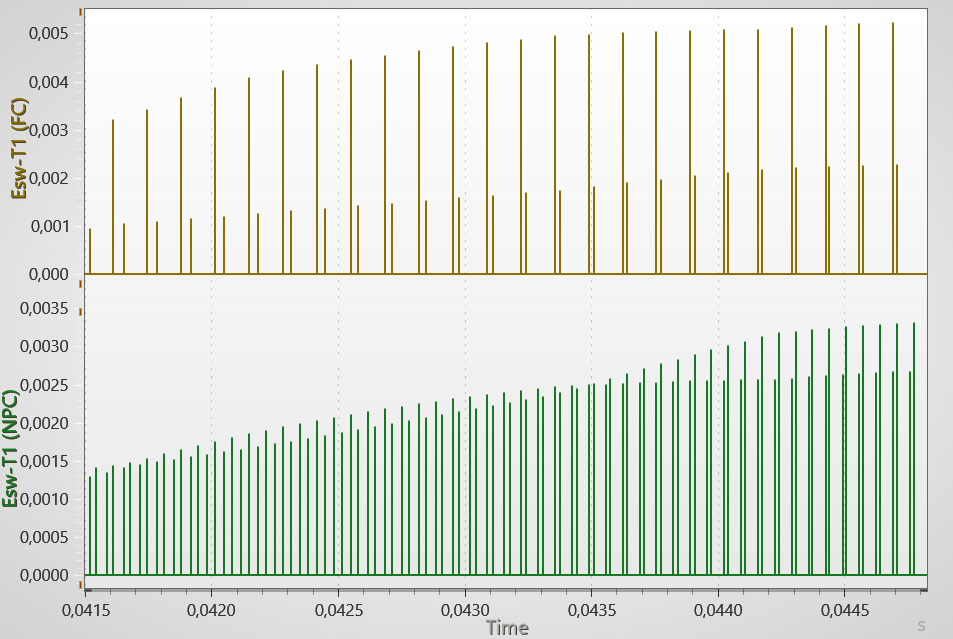
The apparent switching frequency is the switching frequency of the AC voltage waveform. It is twice the real switching frequency of devices for the FC topology and it is the real switching frequency of devices for the NPC and T-type topologies (but for these last ones, the powerswitches only operate during a half period of the fundamental!)
The NPC topology
The T-type topology
The FC topology
info
For the Flying Capacitor Topology, a Phase Disposition (PD) strategy - which allows a lower weight Total Harmonic Distorsion (wTHD) of the phase-phase voltage - has been implemented with a state machine in a C-code.
The ANPC topology
info
For the ANPC Topology, a State Machine has been implemented.
Thermal description
Modules from Infineon module are considered:
- the reference F3L100R07W2H3_B11 for the NPC module,
- the reference F3L200R12W2H3_B11 for the T-Type module,
- the reference IKZ75N65El5 for the FC and ANPC topologies.
The case temperature has been considered constant and has been set to 100 °C.
important
The Dual Stage ElectroThermal (DSET) analysis has been enabled in this example. Therefore, in this example Time Step and End Time parameters are defined for both the electrical stage and the thermal stage analysis.
| Simulation stage | Time Step (s) | End Time (s) |
|---|---|---|
| Electrical | 5e-8 | 0.06 |
| Electrical | T_{sw} | 1.2 |
where T_{sw} is the switching period, T_{sw} = 1 / f_{sw} with f_{sw} = 15 kHz.
Results
Voltage Waveforms and Spectrum
The figures below show the waveforms and the spectrum of the phase-phase voltage of the 3-Level topologies. The voltage waveform of a classic 2-Level inverter has also been plotted for comparison.
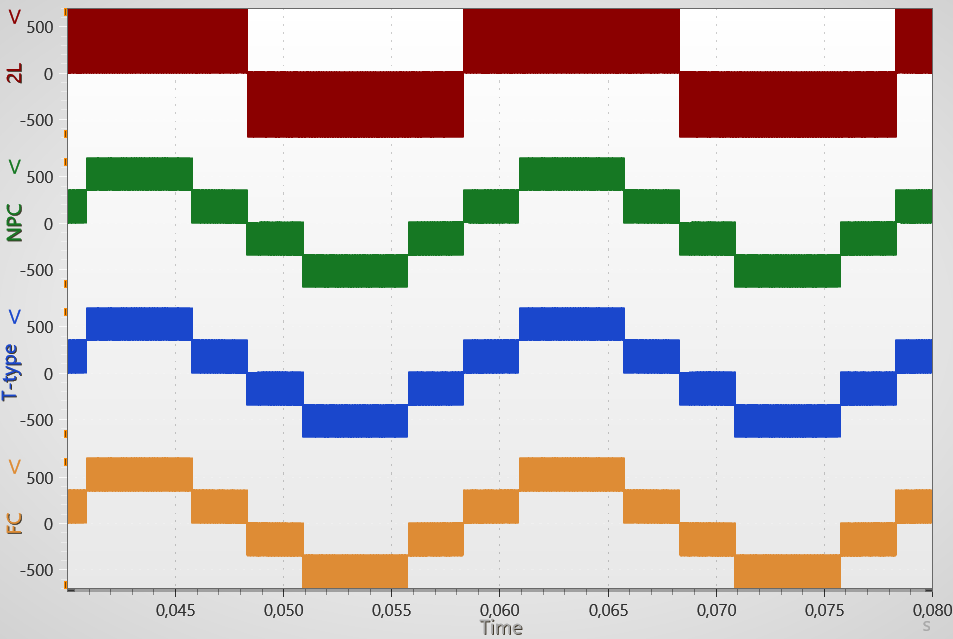
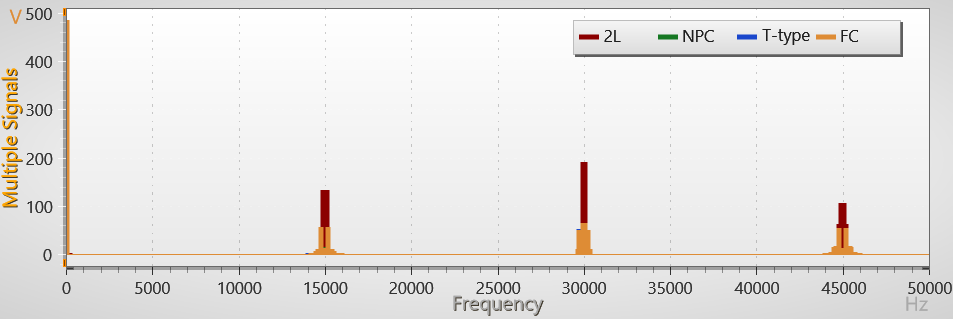
As the apparent switching frequency of the 3-Level topologies is the same, the spectrum are identical. Yet, as previously mentionned, the real swicthing frequency is not the same as shown in the figure below which plots the switching energies of powerswitch T_1 of the FC and the NPC topologies. These differences could lead to different losses as it will be shown in the next section.
Powerswitch losses and junction temperatures
The figure below shows the conduction and switching losses and the junction temperatures of the main powerswitches for each topology: NPC, T-type, FC and ANPC.
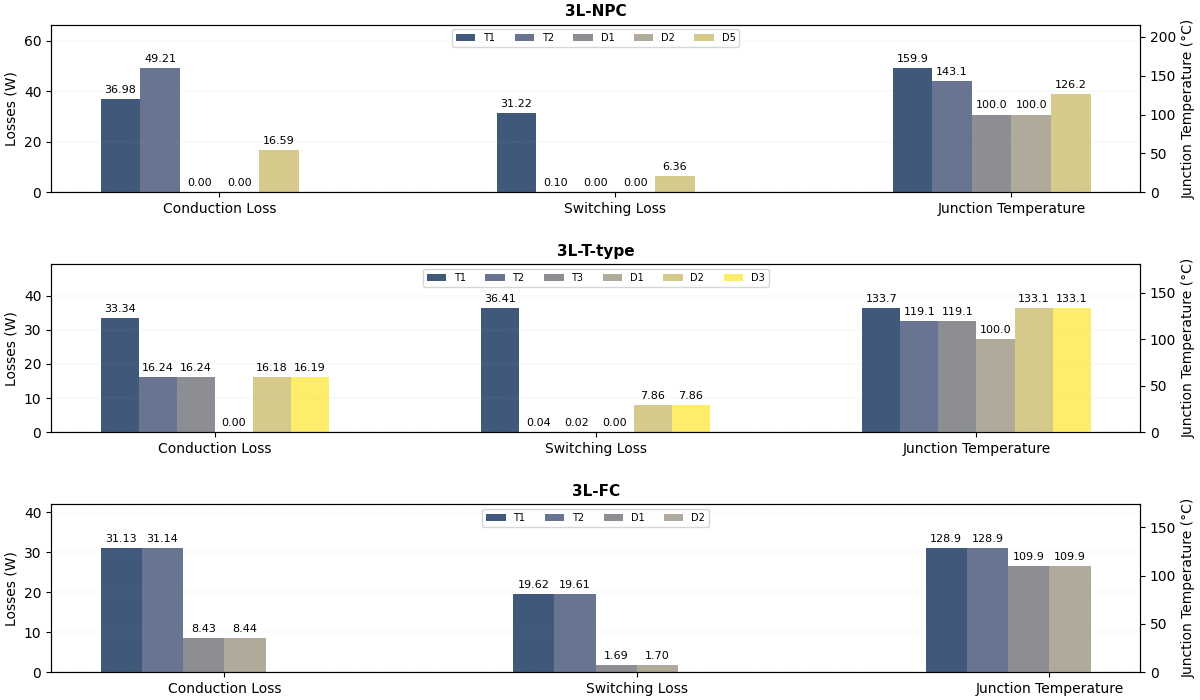
This shows how different topologies can be compared for this kind of benchmark.